Reading Time: 3 minutes
In our Q3 review note, we messed around with Fibonacci Retracement levels against our adtech portfolio of 18 programmatic players.
Fibonacci Retracement: Horizontal lines drawn on our portfolio chart indicate where support and resistance are likely to occur.
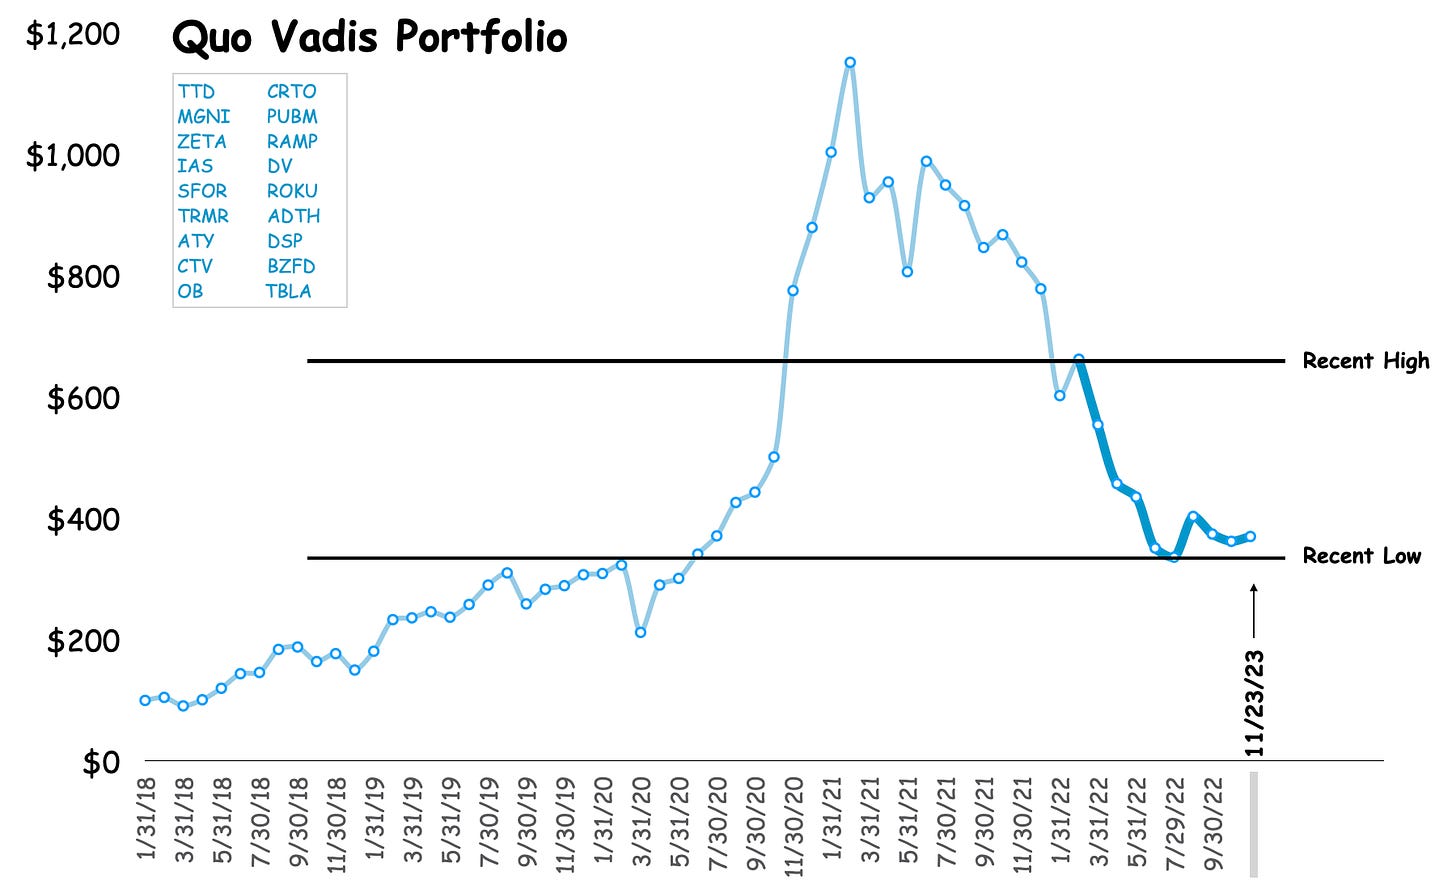
Here’s what it looked like on November 23. We started with the most recent high from February 28 at $662 and the recent low of $336 at the end of July to set an upper and lower boundary. So simple.

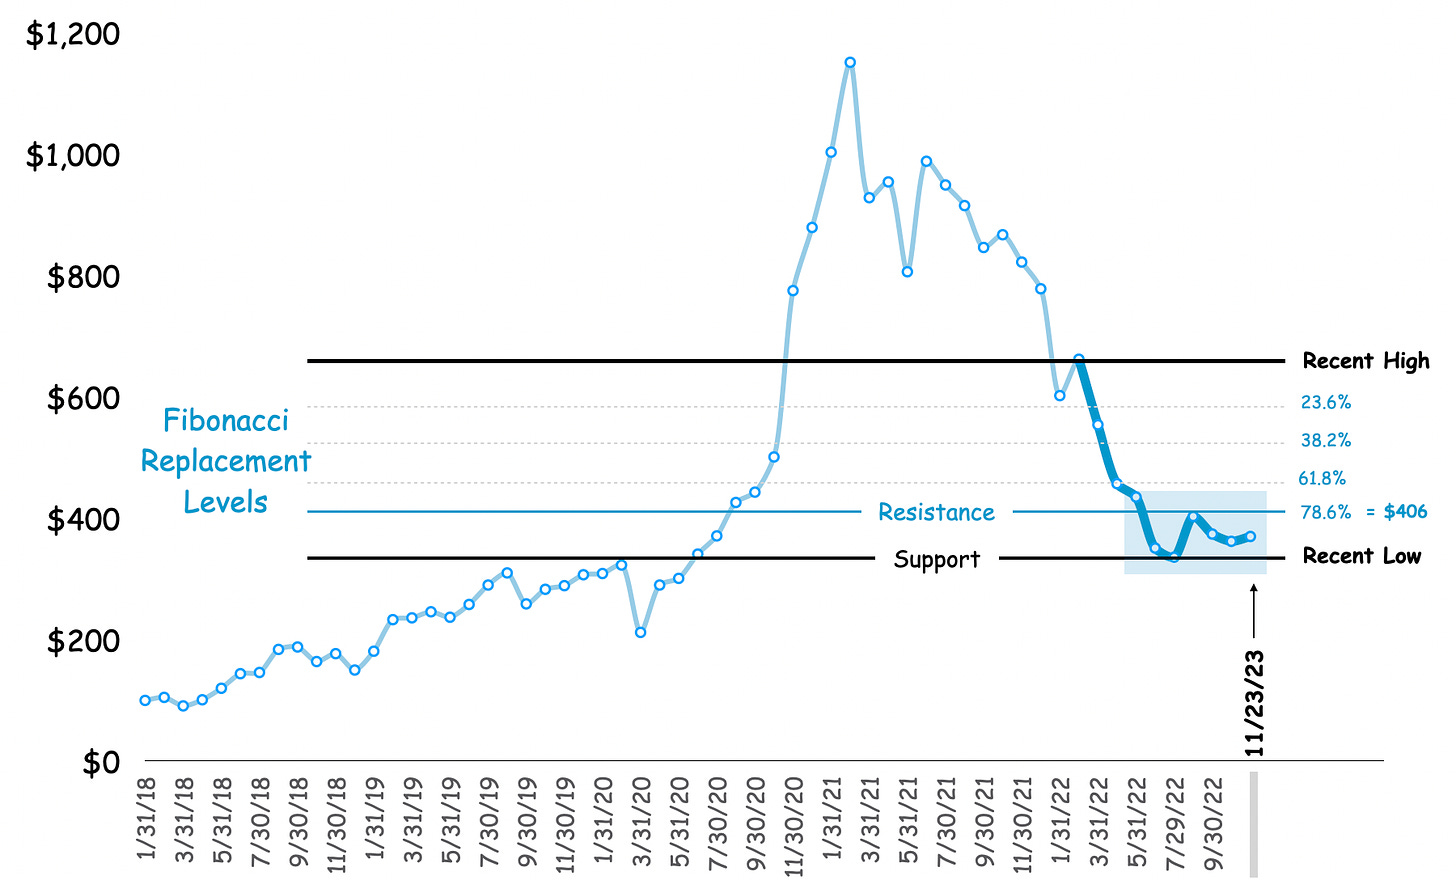
Next, we added Fibonacci Retracement lines at 23.6%, 38.2%, 61.8%, and 78.6% between the high and low.
For example, take the difference between the recent high ($662) and low ($336) which is $326. Now take 78.6% of $326 which is $256. Subtract that from the high to arrive at a $406 retracement line. Voila! Bob’s your uncle! You can learn more here.
So, as of November 23rd, our retracement lines predicted upper boundary resistance at $406 with lower boundary support at the recent low.
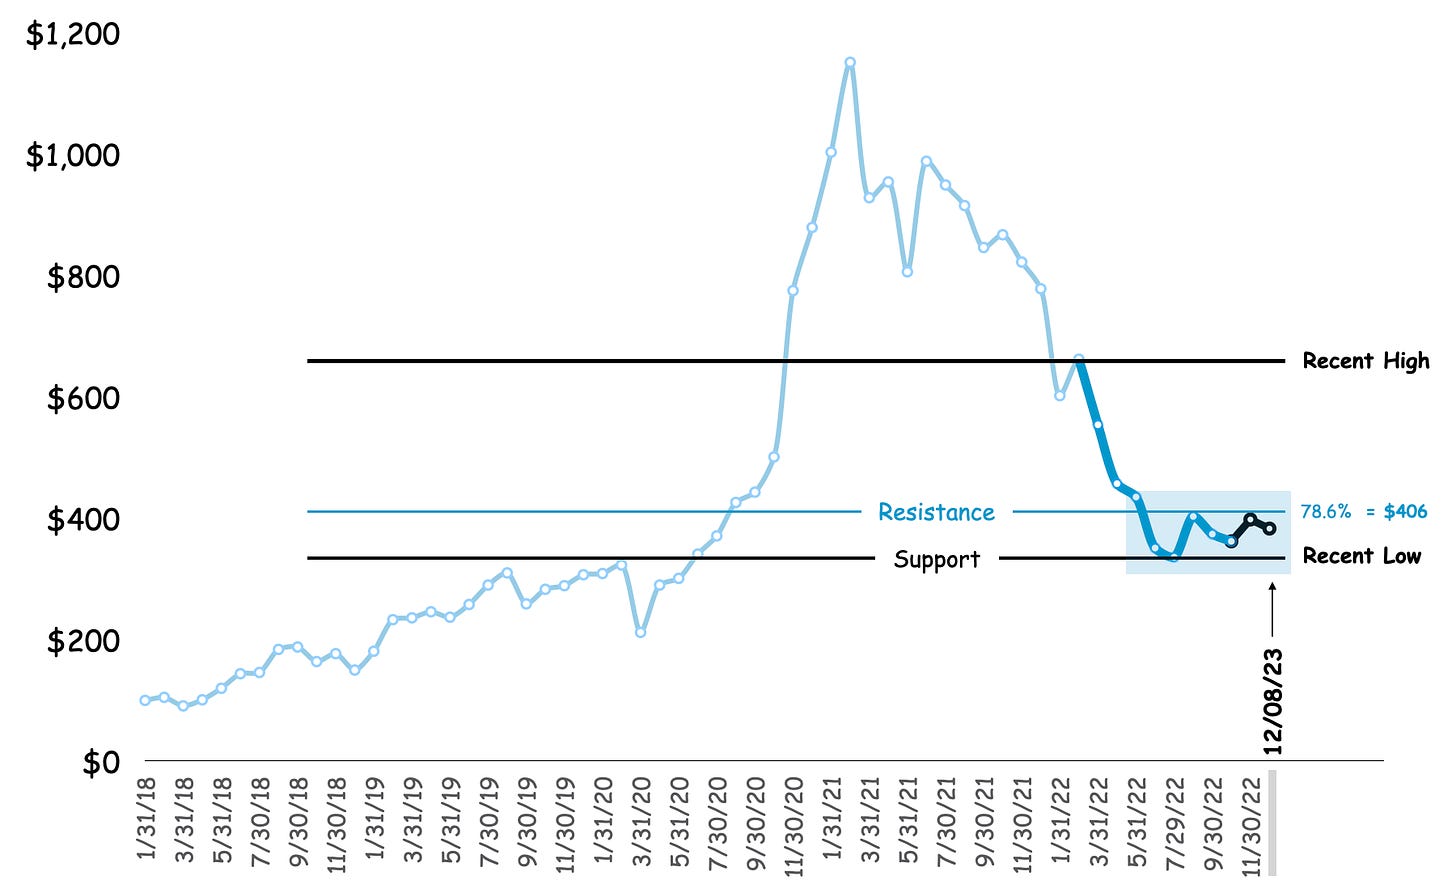
If Fibonacci Retracement runs true, then we should see our portfolio returns bounce around between those two lines until it breaks through resistance or support.
And wouldn’t you know it! As of yesterday’s market close, our portfolio is bobbing up and down as predicted.
Why are we tracking our portfolio against Fibonacci lines?
First, because it’s fun. Second, we’re curious about all kinds of “what ifs?” Third, we want to see if it works — so far so good!
In the spirit of “quo vadis” (Latin translation, where are we headed?), we are on the edge of our seats waiting to see what happens over the next few months. Will our portfolio break through upward resistance, fall below the support line into new territory, or bounce around in stagnation?
You tell us!
Ask Us Anything (About Programmatic)
If you are confused about something, a bunch of other folks are probably confused about the same exact thing. So here’s a no-judgment way to learn more about the programmatic ad world. Ask us anything about the wide world of programmatic, and we’ll select a few questions to answer in our next newsletter.
Join Our Growing Quo Vadis Community
Was this email forwarded to you? Sign up for our monthly newsletter here.
Get Quo Vadis+
When you join our paid subscription, you get at least one new tool every month that will help you make better decisions about programmatic ad strategy.
Off-the-beaten-path models and analysis of publicly traded programmatic companies.
Frameworks to disentangle supply chain cost into radical transparency.
Practical campaign use cases for rapid testing and learning.


