
#116: Going Deeper into the AI AdTech Market Landscape
Jobs-To-Be-Done as a categorizing framework; Going deeper with the underlying dataset

Last week, the corporate dev folks at Liveramp posted a neat chart called AI in Digital Advertising Market Landscape. The adtech community's response on LinkedIn was a positive and well-deserved reception. Everyone loves logo landscapes, and Quo Vadis does too.
The landscape breaks down the world into 4 parent categories and 14 sub-categories with 71 logos, of which a handful cross over between different categories.

That’s the hard part of doing logoscapes. The more you get into it, the more difficult it is to arrive at what McKinsey would call MECE — Mutually Exclusive and Collectively Exhaustive. The principal idea behind MECE is based on two rules:
A finite number of categories.
Each item must fit into just one category.
In other words, take a deck of cards with 52 cards and 4 suits. When you are done playing solitaire, all 52 cards have only one home (mutually exclusive) in one of the four categories, and all the cards end up in order from the ace to king in four piles of 13 cards each (collectively exhaustive). That’s MECE.
Jobs-To-Be-Done as a categorizing framework
It’s difficult to make logoscapes MECE because features and products that sum up to a platform play in different buckets. Another way to categorize AI adtech players is to lean on a Jobs-To-Be-Done framework, aka “outcome-driven innovation.” For instance:
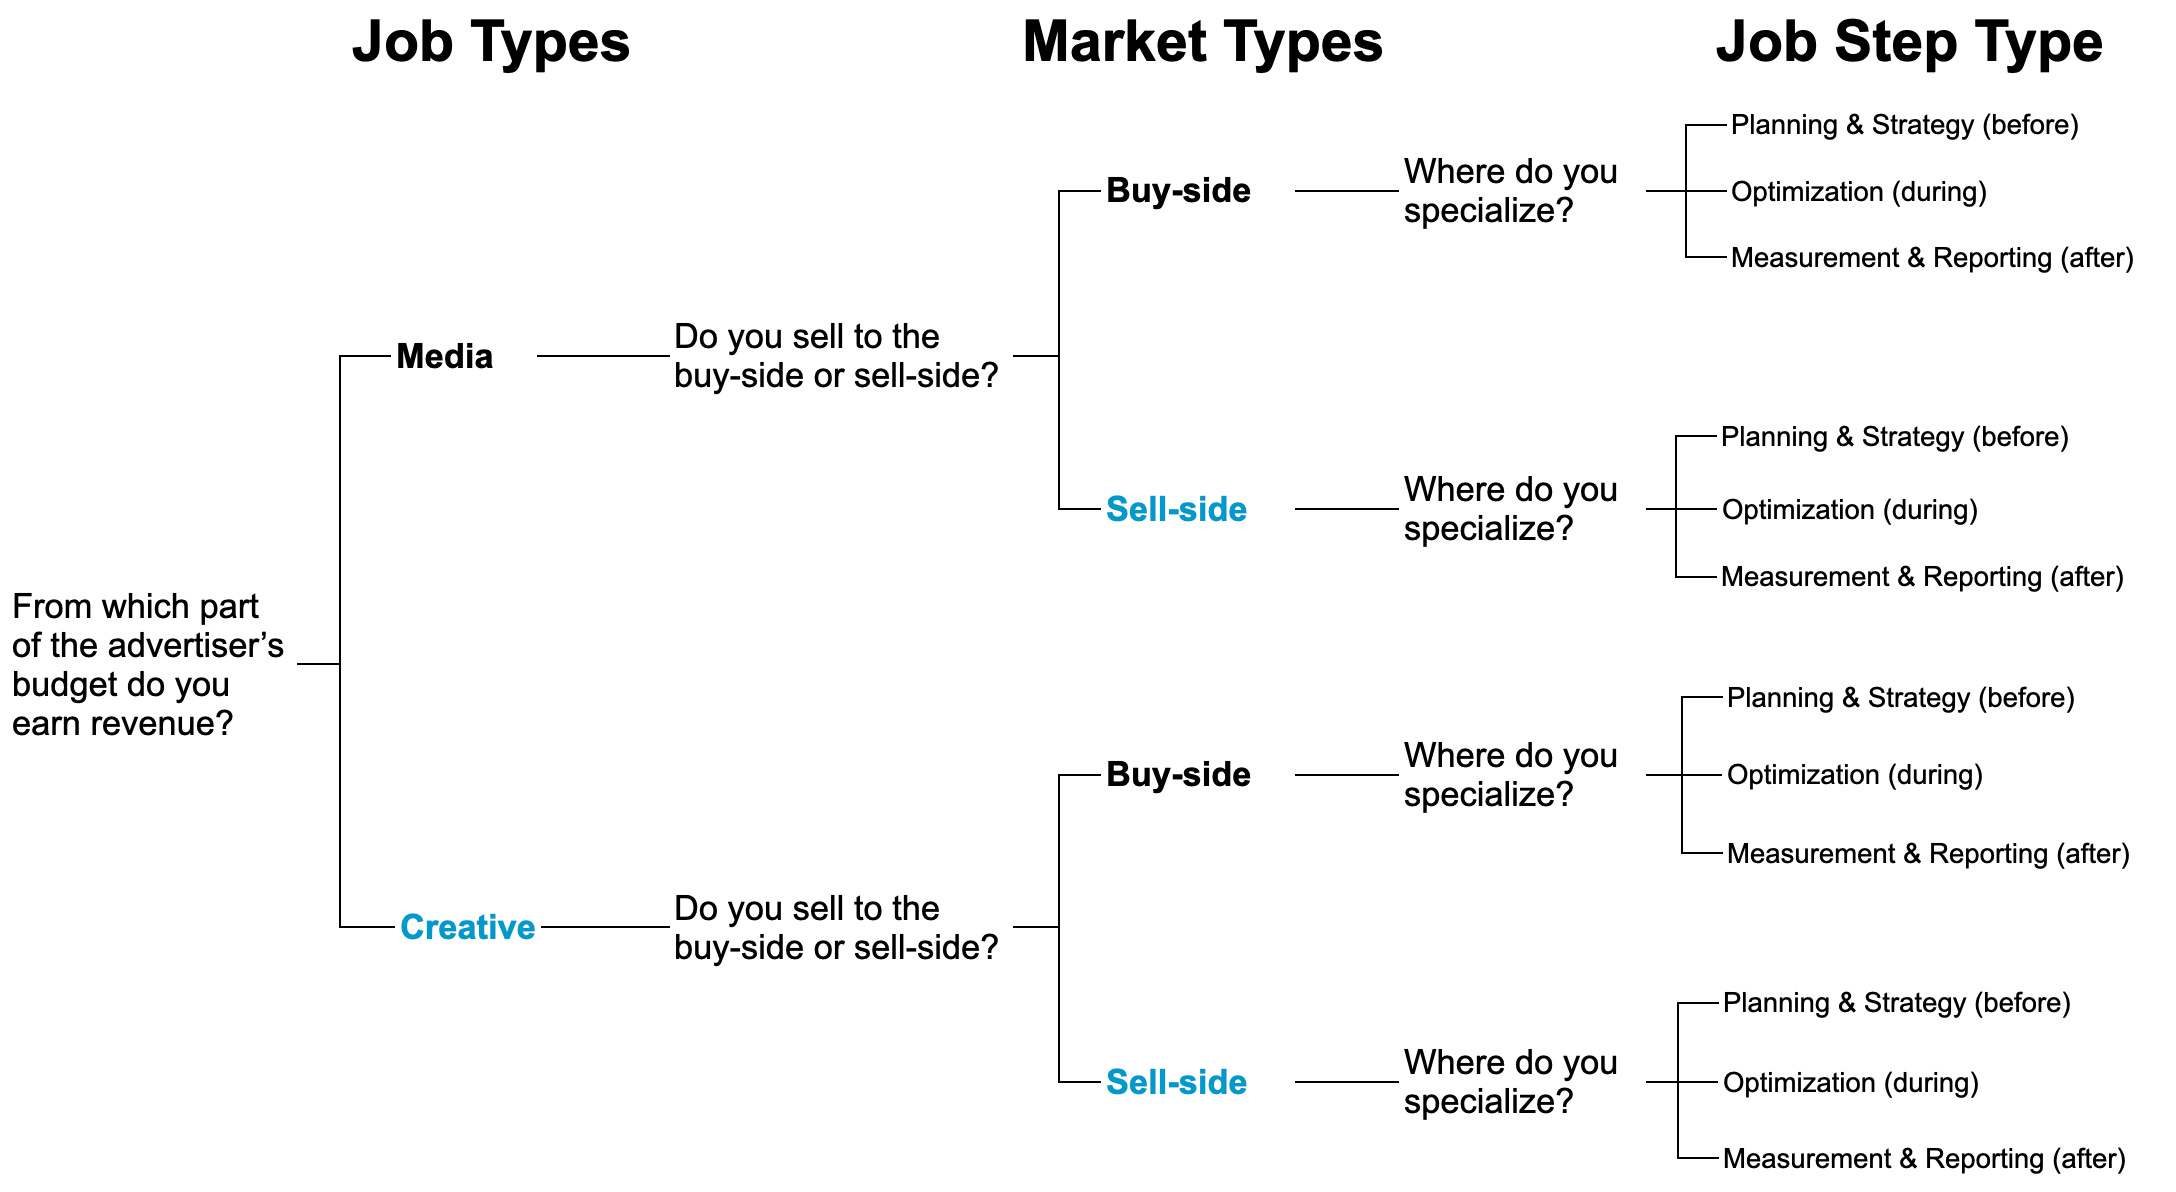
Job Type: An AI adtech can do two job types: Media and/or Creative. In other words, customer budgets come from one of these two buckets.
Market Type: An AI adtech company can have one of two market types: buyer-side or sell-side. In other words, features, products, and platforms often sell to one, and sometimes they sell to both buyers and sellers.
Job Step Type: An AI adtech company gets a job done before, during, or after the buying or selling process.
The before state is generally referred to as planning and strategy. Planning and strategy are jobs done with media and creative, and also on the buy side and sell side.
The during state is generally referred to as optimization. The optimization job is done by both the buy and sell sides, and also by media people and creative people.
The after state is generally referred to as measurement and reporting. Again, measurement and reporting jobs are also done by both the buy and sell side, and also by media people and creative people.
From a combinatorial perspective, an AI adtech company can fall into 12 “types” — 2 Job Types x 2 Market Types x 3 Job Step Types = 12 unique combinations.
Companies that only play in a single combo are probably just a feature, not a product. If a company plays in more than one combo, it will probably look more like a product. When a company plays across several combos, it starts to look like a platform.
Here’s how our categorization concept looks from an issue tree perspective:
Going deeper with the underlying dataset
Logo landscapes (aka “Lumascapes”) present super high-level views of industry players, particularly emerging industries like the crossroad between AI and advertising. While logo landscapes might be interesting to look at from the perspective of realizing how many companies play in an older industry like adtech or an emerging space like AI, they don’t tell you very much.
For instance, check out Chief MarTechs Supergraphic with 15,384 logos. So many in fact that it looks like a random collection of undifferentiated dots.
In any case, what’s infinitely more interesting is to build an underlying dataset underneath a logoscape and then analyze it in search of enlightenment for better decision making in an imperfect world with imperfect information.
Quo Vadis did just that for our subscribers. We built and normalized a dataset from Pitchbook and LinkedIn and analyzed the statistics to share our observations with you.
Importantly, “normalized” means we removed outliers to get the purest view possible. For instance, revenue, total funds raised, and most recent valuation are all exponential distributions with a few big players that distort average and median values.
Macro View
Companies: Liveramp’s landscape includes 71 de-duplicated logos. Several folks commented on LinkedIn about missing companies, so we added six to our dataset, making 77 total companies.
Age: The average company age is 3.6 years. The median age is 3.0 years.
Total Revenue Estimate: We estimate revenue for each company using a linear regression model as a function of company age and current number of employees. Our model is usually accurate with a +/- 10% error rate.
Since the 77 companies in our analysis are characterized as AI + AdTech players and operate within the highly competitive and fickle advertising landscape, we think the past performance of older adtech companies is a good proxy to assess the new players in the same market chasing the same budgets.
The model is based on public company data across ten AdTech companies and ten MarTech companies.
Our adtech comps are: CRTO, TTD, MGNI, PUBM, RAMP, DSP, DV, IAS, TBLA, and OB
Our martech comps are: HUBS, SPT, SHOP, SEMR, TWLO, KVYO, ZI, BRZE, SQSP, and CXM.
For example: PubMatic was born in 2007, making it 17 years old at the end of FY24. Public data gives us employee data from 2020 to 2024 and revenue data from 2018 to 2024. For each one, we use known data and work backwards in time using an exponential log formula to estimate the historical curve going back to age zero. We do the same for employee count, which in turn gives revenue per employee over time (aka “revenue productivity”).
Once have historical curves for each company, we stack them by age to get a composite view of revenue productivity as AdTech and MarTech companies mature. We end up with three neat and highly useful models:
AdTech typically takes media fees, aka “take rate.”
Martech typically charges a SaaS fee
Blended Ad/MarTech model used for companies that have mixed revenue models.
After we apply the blended model to all 77 AI/AdTech companies, we get $645 million in total revenue on a trailing twelve-month basis. Median revenue per company is $2.9 million.
Employees: There are 4,514 total employees across 77 companies with an average of $142K in revenue per employee. The average number of employees at each company is 59, and the median is 26.
Total Funding: Pitchbook provides total funding raised for 61 out of 77 total companies (with a handful of outliers). Although imperfect, after removing outliers, we get an average of $16 million per company. We apply the average to the 16 missing values and arrive at $2 billion in total funding across all 77 companies.
Total Valuation: When we run a similar exercise to get a consistent estimate of “Last Known Valuation,” we get a total of $4.3 billion with an average of $55 million and a median of $42 million.
So far, our statistical estimates tell us a few things:
The valuation multiple on revenue for the sector is 18x. Compare that to public adtech trading around 2.5x ex-TAC revenue.
On average, investors own 29% of the cap table. That sounds about right, given the stage of the game in the emerging AI/advertising space.
Capital Efficiency: Most founders only think about revenue, cost, and cash burn. They typically never think about capital efficiency, but it’s a massive management lever to create shareholder value.
Invested capital is the sum of operating working capital and operating fixed assets, which can include tangible assets like equipment and data or intangible assets like patents, customer lists, capitalized R&D, etc.
Capital efficiency is simply the ratio of revenue (ex-TAC)-invested capital. It measures how much revenue is generated for every $1.00 of invested capital. This key ratio typically grows over time as companies mature.

Age 0 — R&D / Build: No revenue, but investment begins.
Age 1 — Launch: Revenue trickles in, but capital outlays still dominate.
Age 2 — Early Traction: Growth begins, efficiency improves, but still below 1x.
Age 3 — Scaling Begins: Moving into scale, revenue covers more invested capital.
Ages 4 to 5 — Mid-Stage Growth: Business model scaling; assets better leveraged.
Ages 6 to 7 — Efficient Growth: Strong growth, better asset turnover. May vary by business model.
Age 8 to 9 — Early Maturity: Capex slows, working capital better managed.
Age 10 and beyond — Mature / Efficient: Plateau or modest growth with strong efficiency (classic cash cow stage).
Given our 3-year median age, the median capital efficiency for a given company is probably somewhere close to 0.5x. Since total revenue for the group is $645 million, we can back into an estimate of invested capital, which is $1.3 billion.
In other words, these 77 companies have raised $2.0 billion and allocated $1.3 billion to working capital and fixed capital, leaving $700 million in excess cash to support burn rates.
Advice to AI/Advertising founders
#1. Keep an eye on revenue per employee. Set a goal that beats the benchmarks. Incentivize and manage your team toward the goal.
#2. Working capital is dependent on how soon you collect from customers and how late you pay suppliers. If your customers love your feature/product/platform, they’ll pay early. Don’t get caught up in what’s happened to many undifferentiated adtech players. Customers stretch payments to 100 days or more because they don’t value what is offered relative to other priorities.
#3. Capital efficiency creates value. Here’s the proof. Imagine you generate $100 in revenue and have a capital efficiency of 1.0, which means your invested capital is $100. Assume you have a good business generating 20% return on invested capital (ROIC). Since ROIC equals operating profits (assume no taxes for simplicity) divided by invested capital, your operating profit is $20.
If your capital efficiency is 2.0 instead of 1.0, you’d generate the same $100 in revenue on $50 in invested capital. Since your operating profits are unchanged at $20, you boost ROIC to 40%, which is exactly where you want to be.
For northstar comparison sake, Google and Meta generate 40% to 50 %+ ROIC year after year. They are cash printing presses for their shareholders.
Disclaimer: This post, and any other post from Quo Vadis, should not be considered investment advice. This content is for informational purposes only. You should not construe this information, or any other material from Quo Vadis, as investment, financial, or any other form of advice.